Highlights
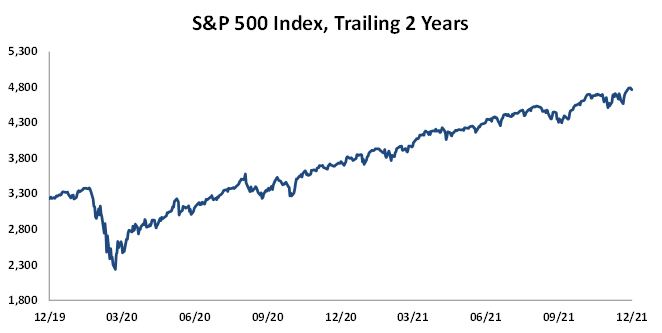
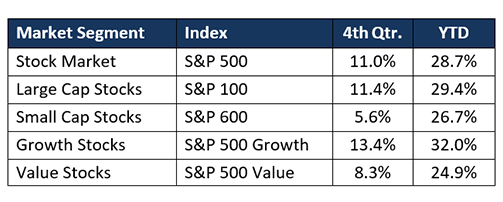
- With a gain of 11.0% in the fourth quarter, the S&P 500 returned 28.7% in 2021.
- Growth stocks outperformed value stocks by 5.1% in the quarter and 7.1% for the year.
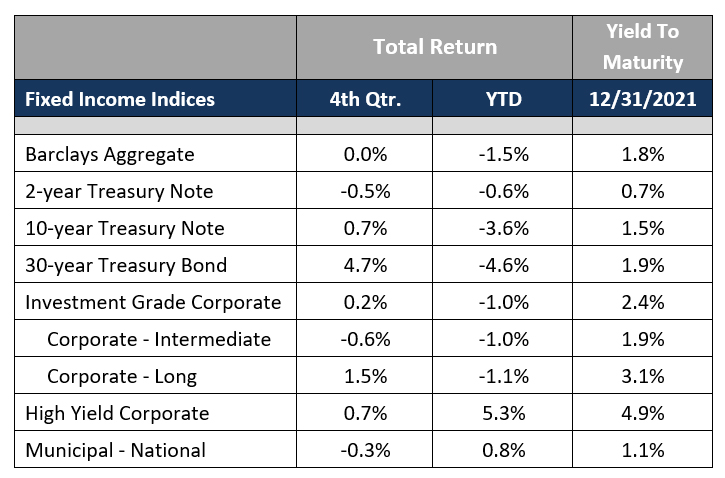
- The U.S. Aggregate fixed income index was flat for the quarter and returned -1.5% for the year.
- The Federal Reserve’s preferred measure of inflation was up 5.7% for the year ending November.
- As of December 31, the S&P 500 traded at 25 times estimated 2021 earnings.
- Analysts are calling for 9.7% earnings growth in 2022.
Equities
Sell the rumor, buy the news. That seemed to be the philosophy of equity investors in the fourth quarter. Concern that continued high inflation would force the Federal Reserve to tighten monetary policy sooner than later led to weak equity returns in the third quarter. However, the November and December announcements that the Fed would begin reducing its asset purchases and speed up the reduction coincided with a strong quarter for stocks, even as bond prices fell. As a result, the S&P 500 returned 11.0% for the fourth quarter, which brought its return for 2021 to an astonishing 28.7%.
A small number of companies continued to lead the S&P 500 higher, with just six of the five hundred stocks in the index (Apple, Microsoft, Alphabet/Google, Amazon, Nvidia, Facebook) accounting for over 30% of the return in the last year. As shown below, large capitalization stocks provided double the returns of small cap stocks in the fourth quarter and outperformed small caps by 2.7% for the full year. Growth stocks outperformed value stocks by 5.1% in the quarter and by 7.1% for all of 2021.
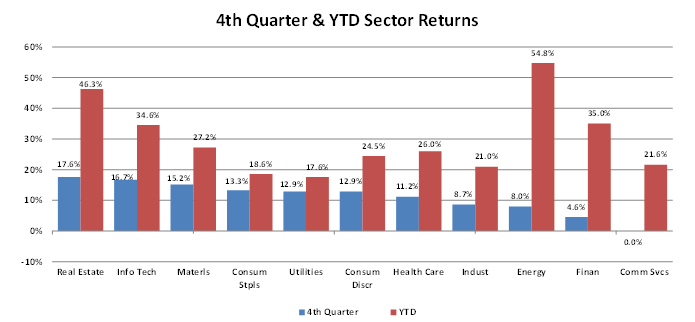
The Real Estate, Information Technology, and Materials sectors were the best performers in the fourth quarter, while Communications Services, Financials, and Energy were the worst. However, for the full year, Energy was easily the best performing sector, while Real Estate, Financials, and Information Technology all returned over 30%. Demonstrating the market’s strong risk appetite in 2021, only the Utilities and Consumer Staples sectors returned less than 20%.
Corporate earnings reports in the fourth quarter (for the third quarter) continued to be strong as many companies benefitted from the unprecedented fiscal stimulus of the last eighteen months. Analysts now estimate that the S&P 500’s 2021 earnings will increase by 103% over pandemic depressed 2020 earnings and 37% over 2019’s earnings. Over the last three years, the S&P 500 has returned 26% annually even as the annual growth rates of both GDP and the earnings of companies in the index have been only 4% and 13%, respectively. The increase in valuation multiples over this time accounts for the discrepancy between stock returns and underlying economic results.
Fixed Income
In September, the Federal Open Markets Committee (FOMC) had given notice that it might start to reduce its bond purchases (quantitative easing) which serve to hold down long-term interest rates. In November, the FOMC followed through by cutting its Treasury and mortgage-backed security purchases by $10 billion and $5 billion, respectively, in each of November and December. At its December 15 meeting, the Fed accelerated the pace of this reduction for January to $20 billion and $10 billion. If it continues at that rate, the Fed will end its quantitative easing program by the end of March. In the same meeting, the FOMC participants indicated that in 2022 it would increase the Fed Funds rate from the current level of 0.0% – 0.25%. Whereas only half of the FOMC members in
September supported increasing the rate by the end of 2022, the support in December was unanimous, with the median estimate being for three rate hikes in 2022. More recently some of those members have suggested that the Fed may want to begin reducing its balance sheet from its current $8.8 trillion (up from $4.2 trillion at the beginning of 2020) shortly after beginning to raise rates. The shift in the FOMC’s stance reflects concern about the sustained and increased rate of inflation, with the most recent Personal Consumption Expenditures report (the Fed’s favored measure of inflation) showing inflation running at 5.7% year over year, while the Consumer Price increased 7.0%. Though the Fed changed its inflation target last year to an “average” rate of 2%, the actual rate has been well above that level since March.
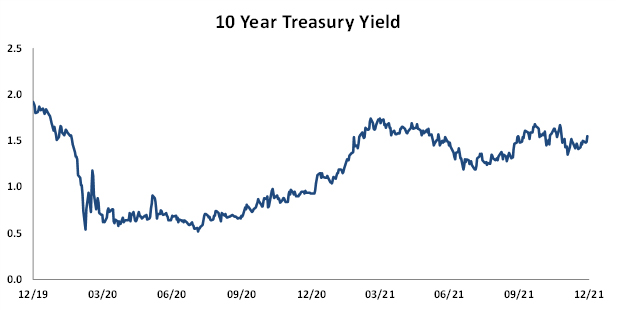
During the fourth quarter, short-term interest rates rose sharply, while longer-term yields were flat or down slightly. For example, the 2-year Treasury note yield more than doubled to 0.7%, resulting in a total return of -0.5%, and the 30-year Treasury bond yield fell 20 basis points, resulting in a total return of 4.7%. Although credit spreads tightened across the curve, intermediate corporate bonds posted negative returns due to the rise in shorter rates, while long-term corporate bonds delivered positive returns. The upward shift in short-term rates led to a flattening of the yield curve with the spread between 2 year and 30-year Treasury securities falling from 1.8% to 1.2%. High-yield (“junk”) bond returns benefitted from a narrowing of risk spreads, leading to a 0.7% return for the quarter and a 5.3% return year-to-date, reflecting the correlation of high-yield bond and equity returns.
Market Environment
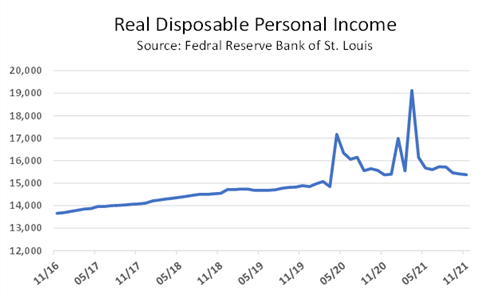
The three substantial fiscal stimulus measures of the last two years led directly to the higher inflation rates we are seeing now as consumers flush with cash (see chart below) sought to buy more goods at the same time as COVID disrupted supply chains. Driven by this fiscal stimulus, coming on top of the
record monetary stimulus in 2020, asset markets showed multiple signs of a speculative mindset. The appearance of “meme stocks” early in the year demonstrated the widespread use of leverage (call options) in driving prices higher, most spectacularly in the cases of AMC and GameStop. In fact, 2021 marked the first year ever that the notional value of traded options (the value of the underlying stock) exceeded the value of actual stock transactions. Another sign of the speculative bent of investors in the last year was the high market valuations awarded to companies that had never made money or in some cases had barely produced a product. Through November, 70% of the companies doing traditional initial public offerings were unprofitable, a higher percentage than during the tech bubble of the early 2000’s. Finally, Special Purpose Acquisition Companies (SPACs), which raise money from investors in hopes of merging with a private operating company and taking it public, raised more money in 2021 than they had in the entire previous decade.
Although risk hungry investors helped the stock market post its third straight year of double-digit gains in 2021, not everyone was overjoyed. As the chart below shows, consumer sentiment, as measured by the University of Michigan Consumer Sentiment survey, fell to its lowest level since 2008, a year in which the S&P 500 fell 38%. The 13% drop in sentiment in 2021 followed a 19% decline in 2020. Why is the consumer so gloomy when the stock market is so strong? Certainly, pandemic weariness is part of the answer. People are tired of the uncertainty around whether schools will be open or when they
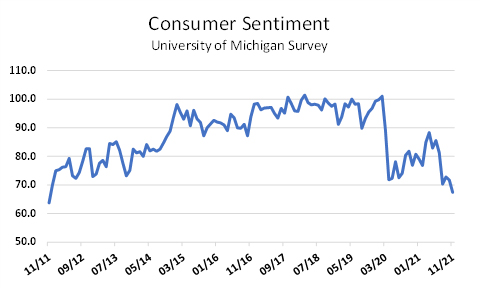
might go back to the office. But in addition to the seemingly never-ending pandemic, consumers are facing the highest rate of inflation since 1982, with 25% of the respondents in the University of Michigan survey saying that their living standards had suffered due to inflation. The massive fiscal stimulation of the last two years has finally generated the inflation that the Fed wanted to see, and no one is very happy about it. Finally, another reason for the disconnect between the euphoria of the markets and the weak consumer sentiment could just be that only about 55% of American households own stocks.
Where we go from here is, of course, impossible to forecast. Some of the fiscal stimulus provided by Congress, such as the enhanced child tax credit, has already gone away and the prospect for much more looks very dim. The rise in short rates during the fourth quarter, and, more recently, the rise in longer rates threaten to derail an equity market that has thrived on an easy money policy for the last decade. No one can be sure how “transitory” inflation may be. The steps the Fed has recently suggested amount to only baby steps in tightening monetary policy. If inflation settles around, say, 4.0% and the ten-year Treasury yield increases to 2.5%, you would have a real yield of -1.5%, which is still stimulative. But will the Fed be willing to increase rates enough to move the yield into positive territory when that almost certainly would produce a significant stock market correction? Given the history of the last 10 years, you’d have to bet they won’t. But in that case, they run the risk of inflation running at levels well above the targeted 2.0%, with all the negative consequences for real wages that ensue. And then there’s also the risk that the Fed tightens too quickly and produces not just a market decline, but an economic recession. One thing’s for sure, none of the choices are appealing.
Focusing on Long-Term Results
With stocks at lofty valuations and bond yields low, these are challenging times for all investors. Navigating this market environment requires consistent focus on long-term goals and an appropriate allocation of assets. At Buckhead Capital, we work hard to help our clients clarify and achieve their financial goals. We try to understand the lessons that markets have provided and to use that knowledge in structuring portfolios to preserve and grow our clients’ capital. We continue to emphasize achieving an appropriate return for the risk taken. We do this not only through asset allocation (the mix of stocks, bonds, and cash) but also through individual security selection, sector weightings, and, in fixed income, target portfolio maturities/durations. This attention to risk management has historically produced better risk-adjusted returns over full market cycles. We continue to believe that this market cycle will be no exception.