Highlights
- Adding to its 6.2% gain in the first quarter, the S&P 500 returned 8.6% in the second quarter.
- Growth stocks outperformed value stocks by 6.9% in the quarter.
- The broadest measure of the fixed income markets returned 1.8% as interest rates fell.
- Inflation surged, with the Consumer Price Index rising at a 5.0% rate for the year ending in May.
- Real GDP growth is forecast to be 6.5% – 7.0% in 2021 and 3.5% – 4.0% in 2022.
- As of June 30, the S&P 500 traded at 25 times estimated 2021 earnings.
Equities
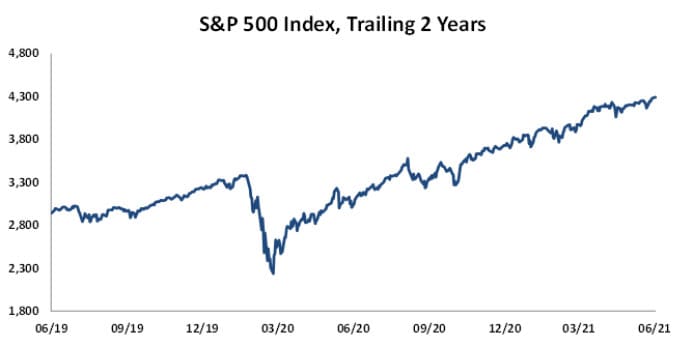
Inflation. Do we have it? Is it transitory? Does it matter? Suddenly, everyone seemed to be talking about inflation. However, so long as stock prices continued to inflate, equity investors didn’t worry too much about broader price inflation, the spread of the Coronavirus’ Delta variant, or the possibility that growth would fade with the waning of economic stimulus in the fall. Focusing simply on the strong earnings rebound off year-ago comparisons, investors repeatedly drove equity prices to new highs in the second quarter. Closing out June with five days of record highs, the S&P 500 returned 8.6% for the quarter. With a total of 34 new closing highs, the S&P 500’s return for the for the first half of the year was an impressive 15.2%.
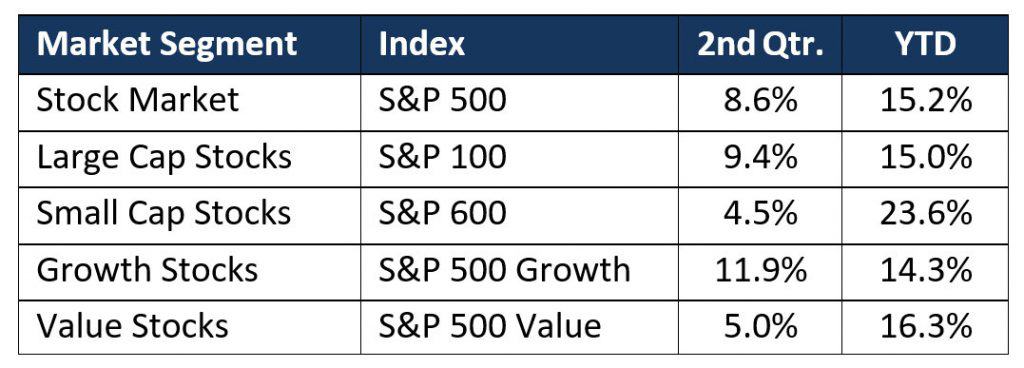
As shown in the table below, large capitalization stocks gained almost 5.0% more than small-cap stocks in the second quarter. However, small-cap performance for the first half of the year remained almost 9% better than large caps. In a reversal from the first quarter, growth stocks outperformed value stocks in the second quarter, although value stocks still led growth by 2.0% for the first six months.
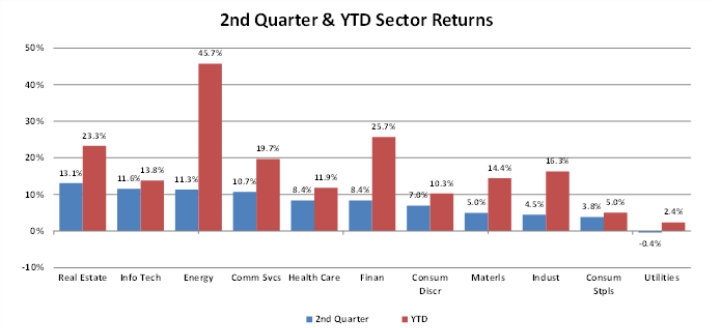
Every sector except Utilities produced positive returns in the second quarter. Concerns about inflation and yield scarcity benefitted the Real Estate sector which increased 13.1%. The rotation from value to growth during the quarter helped push the Information Technology sector up 11.6%, while an almost 25% increase in oil prices resulted in Energy stocks gaining 11.3%. For the first half of the year, the Energy sector (+45.7%) was the best performer as the increased rate of vaccinations led to more travel and demand for oil products. The shift to higher interest rates since the end of the year benefitted both the Financial (+25.7%) and Real Estate (+23.3%) sectors in the first six months of 2021.
With the increased fiscal stimulus provided by the recently enacted $1.9 trillion American Rescue Plan, analysts now estimate that the S&P 500’s 2021 earnings will increase by 86% over earnings in 2020, which fell by 33% from 2019. Interestingly, the earnings estimate for 2021 is roughly 1% higher from the beginning of 2020 while the S&P 500 has returned over 36% in the same period. As a result, valuation multiples have increased from 19 times to 25 times the 2021 estimate.
Fixed Income
After repeatedly stating that interest rate increases were unlikely before 2024, the Federal Reserve’s Open Market Committee (FOMC) ended its June 15-16 meeting with a projection of two Fed Funds rate increases in 2023. (Seven of the eighteen FOMC members projected an increase in 2022.) The proximate cause of this change was the Consumer Price Index report earlier in June that showed 5.0% year-over-year price inflation (3.9% excluding food and energy). Despite this report, Chairman Jerome Powell reassured investors that the Fed was only “talking about talking about” increasing rates or reducing its bond purchases. Meanwhile the target range for the benchmark Fed Funds rate was maintained at 0.0% – 0.25% and the central bank remains committed to purchasing “at least” $80 billion of Treasuries and $40 billion of mortgage-backed securities each month. The Fed continues to insist that these policies will remain in place until “substantial further progress” is made in achieving full employment and “average” inflation over a period of time reaches the 2% target level.
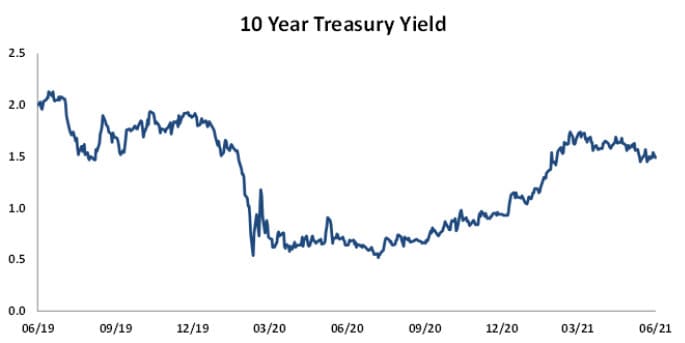
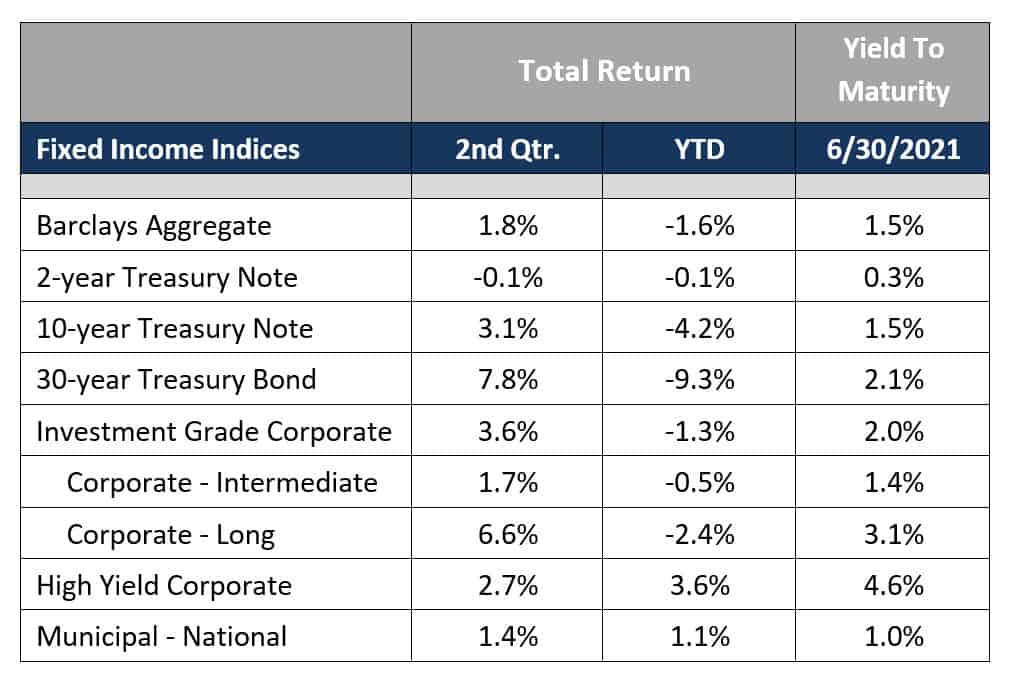
While the acceleration in the Consumer Price Index (+5% year over year in May) clearly concerned some FOMC members, fixed income investors seemed to accept the Chairman’s view that the inflationary pressures were transitory and longer-term Treasury yields generally moved lower during the quarter. For example, the 10-year U.S. Treasury note yield, after a sharp rise from 0.92% to 1.74% in the first quarter, retreated to 1.47% by the end of the second quarter. At the same time, short-term yields (less than 4 years) rose, leading to a flattening of the yield curve. As a result, theBarclays Aggregate Index (the broadest measure of the fixed income market) returned 1.8% in the second quarter, although it still shows a loss of 1.6% (total return) for the first six months of the year. Longer maturity Treasuries benefitted even more from the decline in rates. Investment-grade corporate bond spreads narrowed in the second quarter, leading to better returns than Treasuries. However, corporate returns were still negative for the first half of the year. Municipal bonds (national index) posted a positive return for the quarter, which produced a positive six-month return. High yield (below-investment-grade) corporate bond spreads increased, leading to a lower return than investment grade bonds. Like municipal bonds, high-yield bonds have provided a positive return for the year so far.
Market Environment
The increase in concern about inflation on the part of at least some FOMC participants was one of the notable developments in the second quarter, leading as it did to changing predictions on how soon interest rates might rise. If the equity market becomes convinced that the Fed’s monetary support for the market/economy will be reduced sooner rather than later, it would likely have negative implications for stock prices. So the question of whether this higher rate of inflation will persist and lead to Fed tightening is an important one.
Inflation is the decline of a currency’s purchasing power due to a rise in prices over time. It is usually measured by tracking the change in prices of a group (“basket”) of goods and services. The most commonly referenced inflation index for consumers is the Consumer Price Index (CPI), specifically the Consumer Price Index for All Urban Consumers (CPI-U). This index has been calculated by the Bureau of Labor Statistics since 1913 and tracks the prices of about 80,000 goods and services each month. Critics argue that revisions to this basket over time have served to understate the actual rate of inflation. One of these revisions alters the basket of goods to reflect substitution of purchases (e.g., you buy hamburger when steak prices go up) and the other revision adjusts prices down for improvements in products (e.g., cars are safer and have more entertainment options than ten years ago, so they cost more).
The Fed’s preferred measure of inflation is the Personal Consumption Expenditure (PCE) price index calculated by the Bureau of Economic Analysis (BEA). It looks at a broader range of households and includes prices paid by businesses and governments for services and durable and non-durable goods. It tends to be less volatile than the CPI measure and generally produces lower rates of inflation. In late June, the BEA reported that May’s core PCE price index (excluding food and energy) increased 3.4% from the year before.
With U.S. job openings at record highs in May, many investors expressed concern that the increased rate of inflation would be sustained as labor shortages led to higher wages. In addition, greater oil demand as economies re-open and grow, along with lower oil production in the future, may well lead to higher energy prices over the next decade. Finally, even a modest reversal of the two decades trend of globalization (due to political tensions or the need to shorten supply chains) would remove one of the forces that has restrained goods inflation.
The Fed believes the recent higher-than-expected inflation readings are misleading because they reflect measurements from depressed prices during the pandemic last year (the base effect). The Fed also argues that the higher rates of inflation are transitory since they are due to 1) supply shortages caused by COVID related production problems, 2) a re-opening surge in demand, and 3) labor shortages stemming from a combination of higher unemployment benefits, lack of childcare due to closings, and workers’ fear of COVID. The Fed expects all three of these factors to abate over time. However, the governors of some states have shown less patience than the Fed. With help-wanted signs everywhere, even though seven million fewer people are working than in early 2020, twenty-six states announced that they would decline supplemental Federal unemployment benefits in order to give people a greater incentive to return to work.
As mentioned earlier, the fall in longer-term rates in the second quarter suggests that the bond market is not overly concerned about inflation and is also not convinced that the current rate of economic growth is sustainable. The equity market also seems to believe that the increased inflation rate is transitory. However, it does not appear to recognize that the current rate of growth has been artificially stimulated.
Between March of 2020 and March of 2021, the U.S. government provided $3.6 trillion in monetary support (the increase in the Federal Reserve’s bond holdings) and $5.6 trillion in direct fiscal support. This total of $9.2 trillion amounted to 43% of GDP, greater than any amount (relative to the economy) in the history of the United States. Although often described as “stimulus”, most of this support simply plugged the hole in economic activity that resulted from the COVID-19 pandemic. This is shown by the fact that nominal GDP only increased by $500 billion, from $21.6 trillion to $22.1 trillion, over the same period.
If you consider what the economy and corporate profits might look like absent the tremendous government spending, the picture is decidedly less rosy than current stock prices would lead you to believe. Much of the fiscal support that has aided the economy over the last year (elevated unemployment benefits, direct payments to households, rent and mortgage forbearance) is due to end in the coming months. At that point, the economic growth rate is likely to slow substantially.
Focusing on Long-Term Results
With stocks at lofty valuations and bond yields low, these are challenging times for all investors. Navigating this market environment requires consistent focus on long-term goals and an appropriate allocation of assets. At Buckhead Capital, we work hard to help our clients clarify and achieve their financial goals. We try to understand the lessons that markets have provided and to use that knowledge in structuring portfolios to preserve and grow our clients’ capital. We continue to emphasize achieving an appropriate return for the risk taken. We do this not only through asset allocation (the mix of stocks, bonds, and cash) but also through individual security selection, sector weightings, and, in fixed income, target portfolio maturities/durations. This attention to risk management has historically produced better risk-adjusted returns over full market cycles. We continue to believe that this market cycle will be no exception.